Market rates tell the tale of the size of future rate hikes
From the analysts and economists at the bank, you get the news story. How much will the central bank change the rate at the next meeting, and perhaps also the meeting after that? As rates traders need to make markets every day, they also must anticipate future central bank moves. This involves a lot of money so the bets on rates changes better be the best bet around. In theory, the market rates imply all current expectations of future rates. However, it is not as straight forward as one might think to back-out the central bank hikes from these.
The example below highlights the procedure to extract the implied forecast for the central bank rates (proxied by T/N Stibor), including some needed assumptions on the traded contracts. We will use Quantlab as our analytics tool of choice.
Let us start with the traded instruments needed to do this. First of all we need something that is short enough to encapsulate the upcoming meeting date. So we start with the current O/N rate (which in SEK is the T/N). In some markets, the OIS rates are liquid and can be used for the rest of the exercise. However, in SEK that is not true. We will use the more traded IMM FRA contracts. Unfortunately, the first IMM FRA starts after the next meeting date so it will not give information about the 24th of November. We then have a choice of using RIBA-futures or adding an extra OIS swap. We will do the latter due to the fact that RIBA futures are not very liquid either.
So now that we have decided on which instruments to use, we need to set a spread representing the credit differential between a FRA contract and the compounded T/N rate. Let’s assume this is a flat 4bp spread.
Then there is a well known oddity in the data. As the first IMM FRA contract starts and ends on each side of the new year, and given that the banks have an adjusted demand for money, the rate will be skewed for all contracts encompassing the so called turn effect. We will estimate this years 3M Stibor turn-of-year effect to be about 20bp. This leads us to adjust the rate for the first IMM FRA by adding the 20bp to the quoted yield.
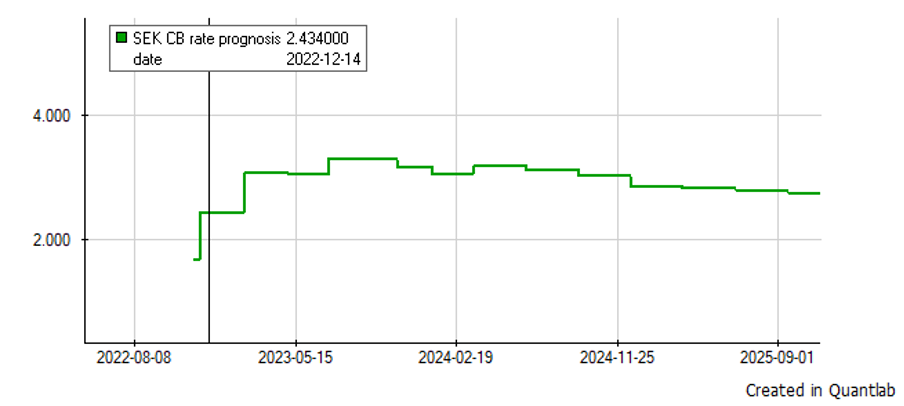
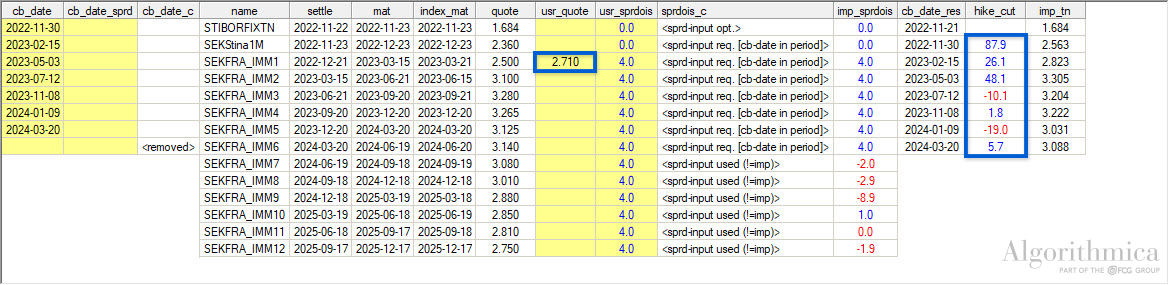
We can now after a fair bit of calculations get to the market implied forcast, given our range of meeting dates. (Actually we set the date from which a new rate will start, i.e. the Wednesday after the meeting.) As today is the the 21st of November, 2022, we get the implied market forcast to be a 87.9bp hike for the next meeting. A 87.9bp hike would imply that the market is divided between a 75bp hike and a 100bp hike. And the meeting after that we get 26bp and so on.
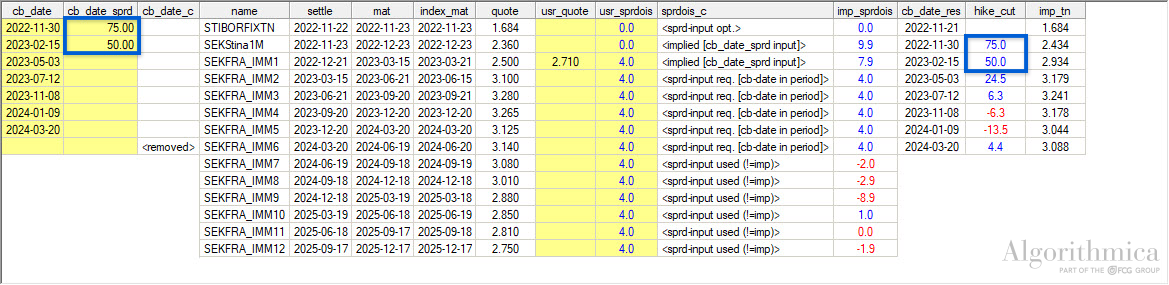
The forecast is very sensitive to the starting values. If the starting values are off, all following rates will be off as well. If we want to nail down the first two meeting as we believe we know the hikes to be say, 75bp and 50bp each. We can now use those as inputs and see that the market rates then indicate the hike/cut starting the 3rd of May, 2023 to be 24.5bp.
In a follow-up post we will look at how to use the inhouse view of the hikes and cuts in the central bank repo rates to calculate break-even prices of other instruments in the market.
If you want to know more on how to use the market quoted rates to back-out expectations and do your own pricing, don’t hesitate to call a Quantlab expert at Algorithmica.
By Robert Thorén and Magnus Nyström, Algorithmica Research
Quantlab is a cross-asset quantitative analytics tool for Quants, Traders and Analysts. Quantlab gives the analyst an efficient framework for financial calculations based on time series data and streaming realtime data, to be used interactively by the analyst, or implemented as a solution for the trading or sales desk.